Why Location Matters More Than Ever in 2026
For 20 years, the federal solar tax credit smoothed out the differences between states. A 30% credit on installation costs was available no matter where you lived. That changed on July 4, 2025, when the One Big Beautiful Bill Act eliminated the residential credit effective December 31, 2025. Homeowners installing solar in 2026 are on their own at the federal level.
What that means practically: your state's electricity rate, available sun, and local incentive programs are now the primary drivers of whether solar is a smart financial move. The gap between the best and worst states just got wider.
How We Ranked the States
Three factors determine how quickly solar pays for itself, and therefore how good a state is for solar investment:
- Peak sun hours: how much usable solar energy your panels can capture each day. Data from the NREL National Solar Radiation Database.
- Electricity rates: the higher your rate, the more money each kilowatt-hour of solar power saves you. Data from the EIA Electric Power Monthly, March 2026. The national average is now $0.1805/kWh, up 5.4% from last year.
- State incentives: tax credits, rebates, net metering policies, and SREC programs that reduce your upfront cost or generate ongoing income from your panels.
The best states score well on at least two of the three. A few exceptional states score well on all three.
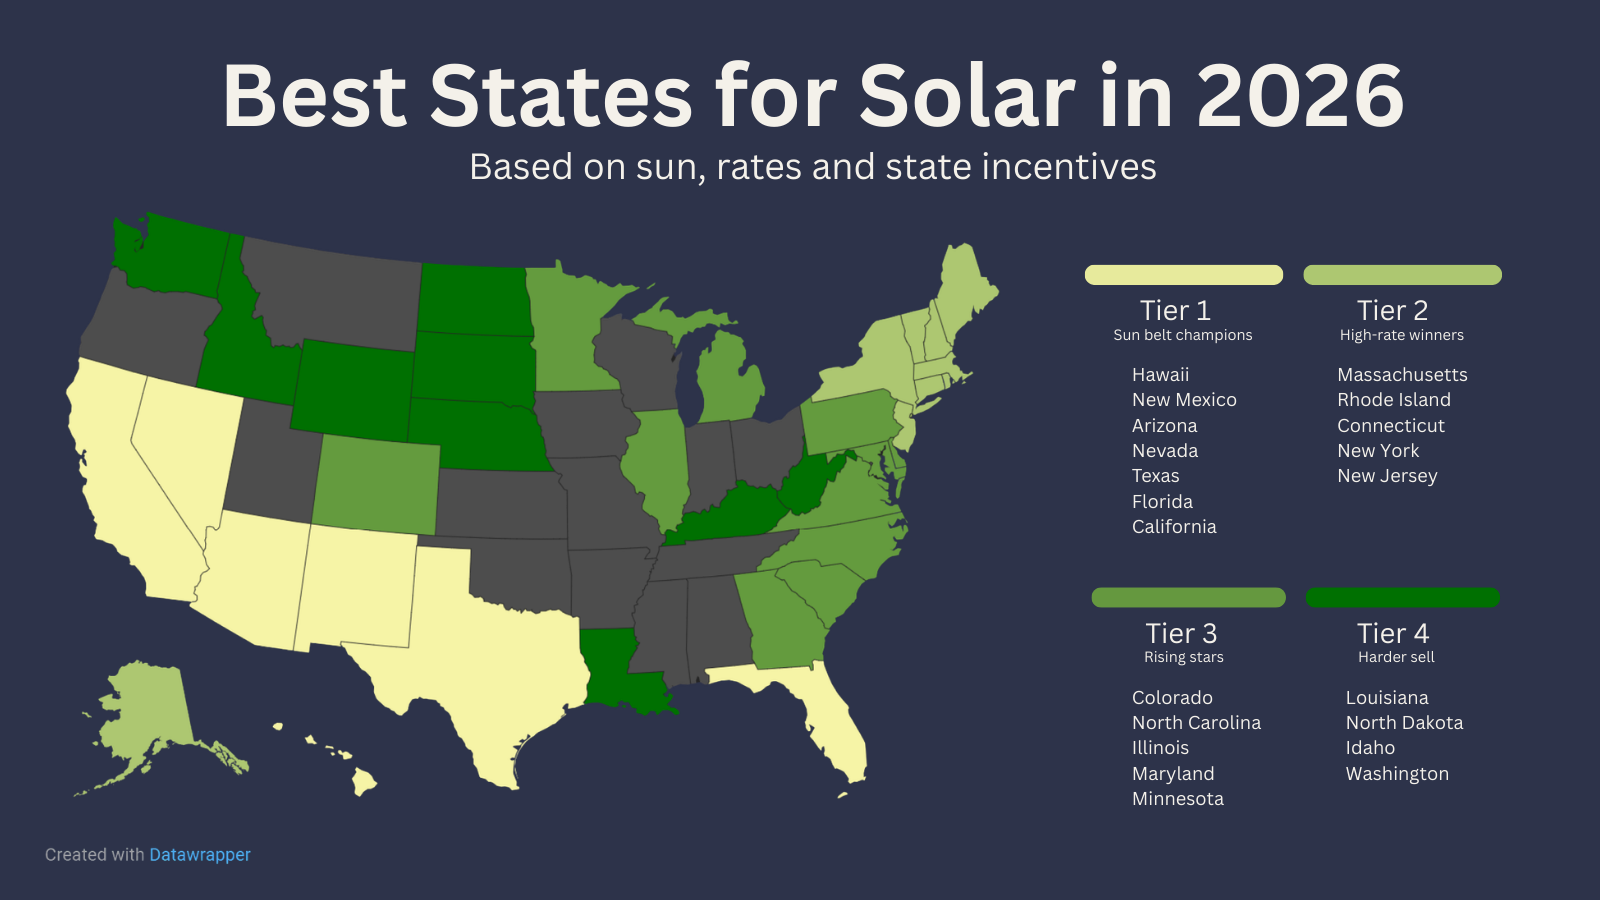
Tier 1: Sun Belt Champions
These states combine strong sun with decent-to-high electricity rates. They're the most straightforward case for solar. Your panels produce a lot of power, and that power is worth a lot.
| State | Avg. Sun Hours/Day | Avg. Rate (¢/kWh) | Key Advantage |
|---|---|---|---|
| Hawaii 🌺 | 5.7 | 40.0¢ | Highest rates in US, fastest payback |
| New Mexico | 6.8 | 15.0¢ | Most sun hours of any state |
| Arizona | 6.6 | 16.0¢ | Payback as short as 3 years |
| Nevada | 6.4 | 14.0¢ | 25% of state electricity from solar |
| Texas | 5.7 | 16.0¢ | 135+ clear days/year, deregulated market |
| Florida | 5.6 | 17.0¢ | ~$2,500/yr savings on avg., sales tax exemption |
| California * | 5.4 | 33.0¢ | Largest solar market in the US — see note below |
* California note: California ranks Tier 1 by raw fundamentals — 5.4 peak sun hours and rates of $0.33/kWh are among the best in the country. However, the state's 2023 switch to NEM 3.0 net metering significantly reduced the credits homeowners earn for excess solar power sent back to the grid, cutting the retail rate to around $0.05–$0.08/kWh for most customers. Solar still pays off in California, but the payback period has lengthened compared to pre-2023. Battery storage now plays a bigger role in making the numbers work. If you're in California, factor NEM 3.0 carefully into your calculations before installing.
Hawaii deserves special mention. At $0.40/kWh, more than twice the national average, every kilowatt-hour your panels produce is worth more than anywhere else in the country. Even though Hawaii has no state income tax credit for solar, the sheer cost of grid electricity makes the math compelling.
Tier 2: High-Rate Winners
You might be surprised to see New England states near the top of any solar ranking. These states don't get a lot of sun, but their electricity rates are so high that solar still pays off faster than in many sunnier states. According to Electric Choice's March 2026 rate data, the Northeast pays 42% more than the national average.
| State | Avg. Sun Hours/Day | Avg. Rate (¢/kWh) | Key Incentive |
|---|---|---|---|
| Massachusetts | 3.8 | 31.5¢ | State tax credit up to $1,000 + SMART program |
| Rhode Island | 3.8 | 31.3¢ | Strong net metering, rising rates (+22.6% last year) |
| Connecticut | 3.9 | 29.0¢ | 2nd highest rates in US, deregulated market |
| New York | 3.8 | 24.0¢ | 25% state tax credit (up to $5,000) + NY-Sun rebates |
| New Jersey | 4.2 | 21.0¢ | SuSI incentive program + full property/sales tax exemption |
New York stands out here. A 25% state tax credit worth up to $5,000, combined with NY-Sun Initiative rebates, means New York residents now have some of the best state-level replacement incentives for the expired federal credit. A typical system can pay itself back in around 7 years, then generate nearly two decades of free electricity.
New Jersey also deserves attention. The Solar Successor Incentive (SuSI) program lets homeowners earn credits for the solar energy they generate, on top of the money they save on their bills. Combined with full property and sales tax exemptions on solar equipment, New Jersey is one of the most financially rewarding states to go solar right now.
Tier 3: Rising Stars
These states don't top the charts in any single category, but they score consistently well across all three, and several have strong incentive programs that close the gap.
- Colorado: 5.5 peak sun hours, rates around $0.16/kWh, and a 2023 clean energy bill that streamlined solar permitting and funding. Xcel Energy and other utilities offer rebates worth hundreds of dollars.
- North Carolina: 4.7 sun hours, $0.13/kWh rates, and a property tax exemption on solar installations. Duke Energy offers rebates up to $9,000 for solar plus battery systems. One of the fastest-growing solar markets in the Southeast.
- Illinois: The Adjustable Block Program (launched 2019) generates SREC income worth $10,000 to $12,000 over 15 years for an average system. It's one of the strongest state incentive programs in the country, making solar financially attractive even with 4.2 sun hours and moderate rates.
- Maryland: 4.2 sun hours, $0.18/kWh rates, SRECs currently earning over $350/year for an average system, and several counties offering additional property tax credits worth up to $5,000/year.
- Minnesota: 4.2 sun hours combined with Xcel Energy's Solar*Rewards program and rates of $0.15/kWh give Minnesota families a genuine solar payback. A Minneapolis household can cut a $140 bill down to around $30.
Where Solar Is a Harder Sell
Some states have the sun but not the rates, and that makes the math tough. If your electricity is cheap, every kilowatt-hour your panels produce is worth less, which means it takes longer to break even.
- Louisiana: The cheapest electricity in the US at $0.12/kWh means solar savings accumulate slowly despite decent sun (4.9 hours/day). Payback periods can stretch to 15 years or more.
- North Dakota: Rates of just $0.11/kWh are the lowest in the lower 48. Combined with cold winters and limited incentives, solar ROI is weak here.
- Idaho and Washington: Abundant cheap hydroelectric power keeps rates at $0.11 to $0.12/kWh. Beautiful states, but the economics of solar are harder to justify than nearly anywhere else in the country.
- West Virginia and Kentucky: Coal-heavy grids keep rates modest at $0.13 to $0.14/kWh, and state-level solar incentives are limited.
The Federal Credit Is Gone. What Now?
The expiration of the 30% federal credit is the biggest shift in residential solar policy in 20 years. For a typical $25,000 system, that credit was worth $7,500, a substantial reduction in upfront cost that made the math work in a lot of states where it otherwise wouldn't.
Without it, the states that remain financially attractive for solar are those where savings from high electricity bills can cover the full system cost on their own, and those with strong state-level replacement incentives. New York, New Jersey, Illinois, and Massachusetts have done the most to fill the gap.
If you're in a state without strong incentives and with cheap electricity, it's worth waiting to see whether your state legislature responds to the federal credit expiration with new programs. Several states are already discussing this.
Calculate Your State's Solar Potential
The numbers in this article are state averages. Your actual ROI depends on your specific location, roof orientation, system size, and local utility rates. Before running the numbers, it's worth checking whether your home is a good candidate — our free 16-point home readiness checklist covers everything from roof condition to electrical panel capacity. Then use our free Solar ROI Calculator to get a personalized estimate in seconds, updated with March 2026 EIA rates for all 50 states.
Sources
- U.S. Energy Information Administration — Electric Power Monthly, March 2026
- NREL — National Solar Radiation Database (NSRDB)
- Electric Choice — Electricity Rates by State, March 2026
- SolarReviews — The 10 Best States for Home Solar
- Solar.com — Solar Incentives by State (2026)
- Enact Solar — Top 5 States for a Home Solar System (2025)
- SolarInsure — Final Changes to the Solar Tax Credit from H.R. 1
- SEIA — Clean Energy Provisions in the One Big Beautiful Bill